See what you would receive.
A complete restaurant location example generated with the production report template: executive decision, scores, maps, indicators and appendix. Every data point is entirely fictional.
This document only demonstrates the report structure and level of detail. It does not represent a real location or analysis.
The report decides, and says why.
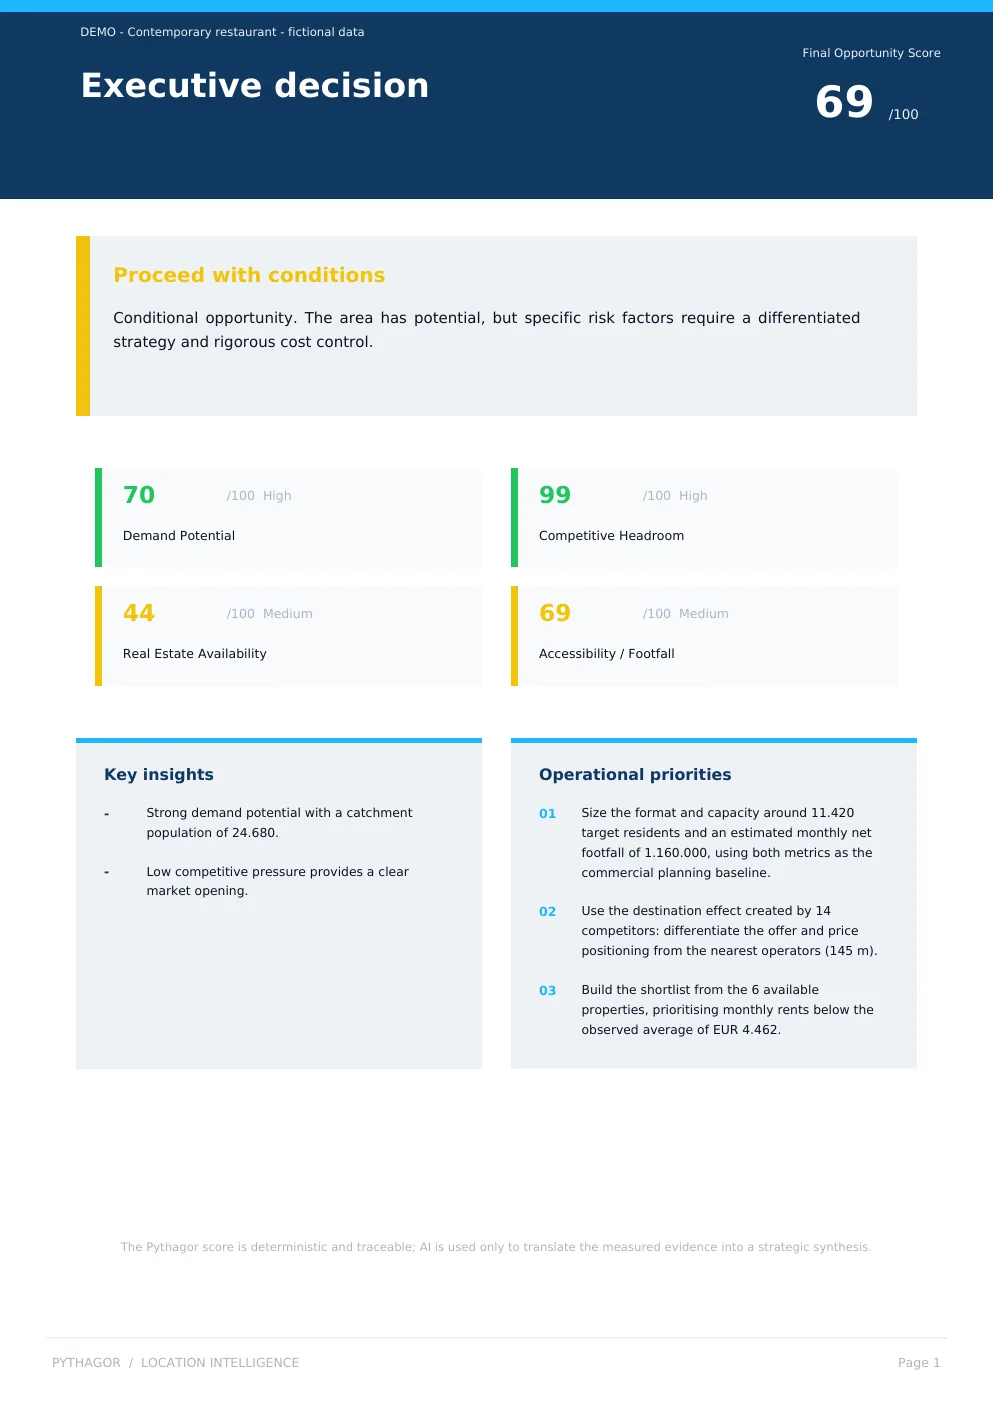
It opens with a verdict — 69 out of 100, proceed with conditions — then shows the four numbers behind it, what to do about it, and how that score was calculated.
Moment 1 of 4
The verdict
It opens with a decision, not a table: 69 out of 100, proceed with conditions.
Moment 2 of 4
The four numbers behind it
The verdict rests on four measures. Competitive space is wide, 99. Real estate is the weak point, 44.
Moment 3 of 4
What to do about it
And it says what to do: size the format for the 11,420 target residents, differentiate from the 14 competitors 145 metres away, start from the 6 available units.
Moment 4 of 4
Where the score comes from
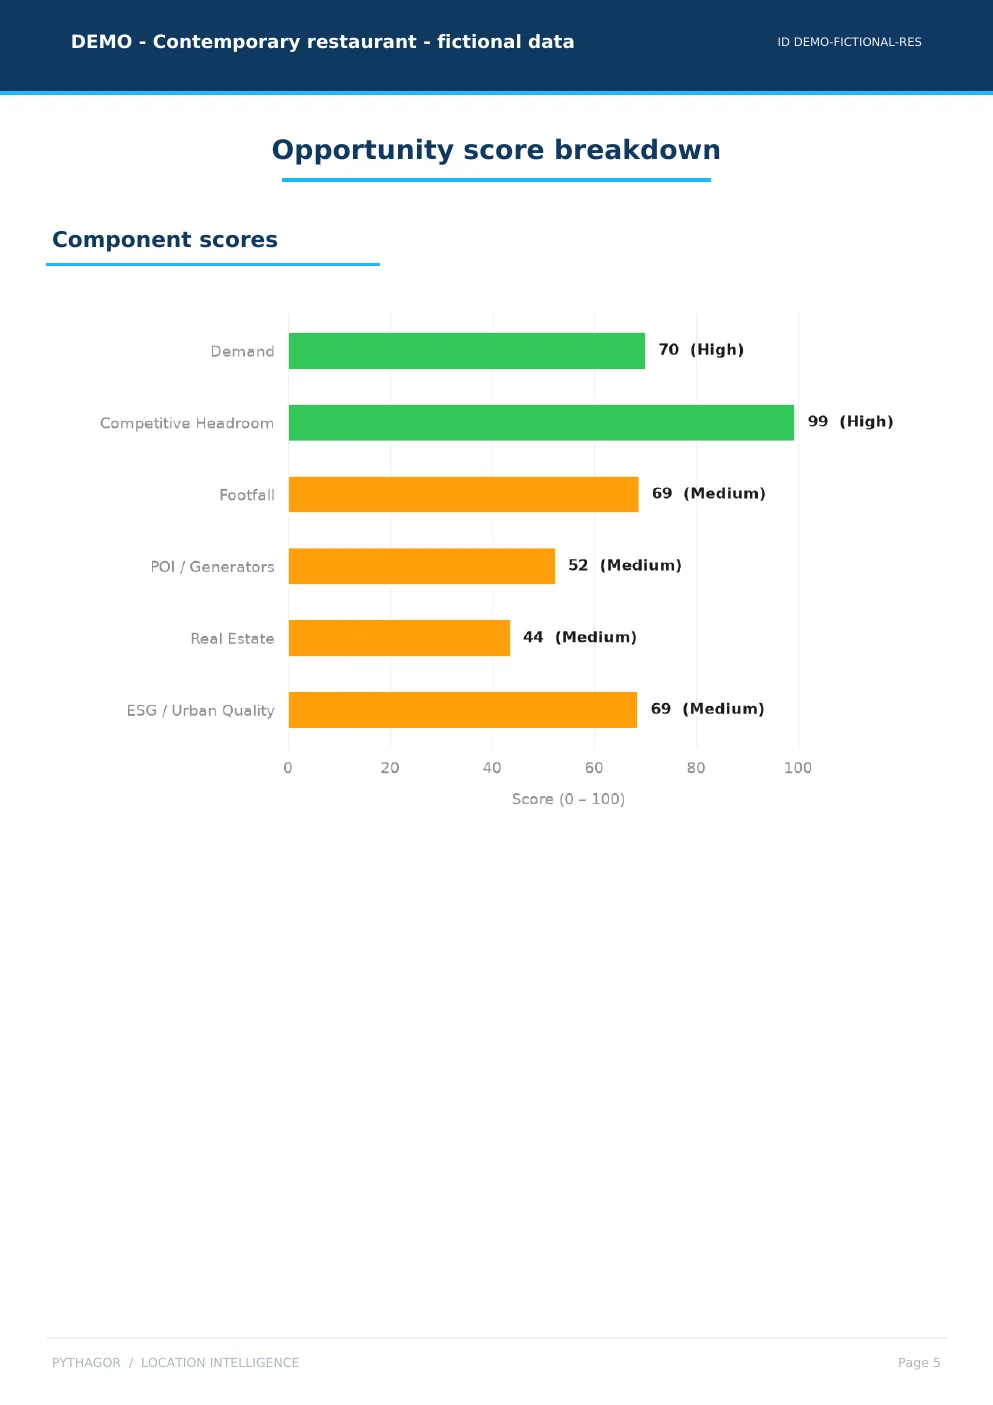
Six components, each with a declared weight — for a restaurant demand is worth 34%, footfall 6%. The score is deterministic: the same data produces the same number.


The six measures behind the score.
The score comes from six measures, each with a declared weight. Here they all are, heaviest first: for a restaurant that runs from demand at 34% to footfall at 6%.
Evidence 1 of 6
Who lives in the catchment
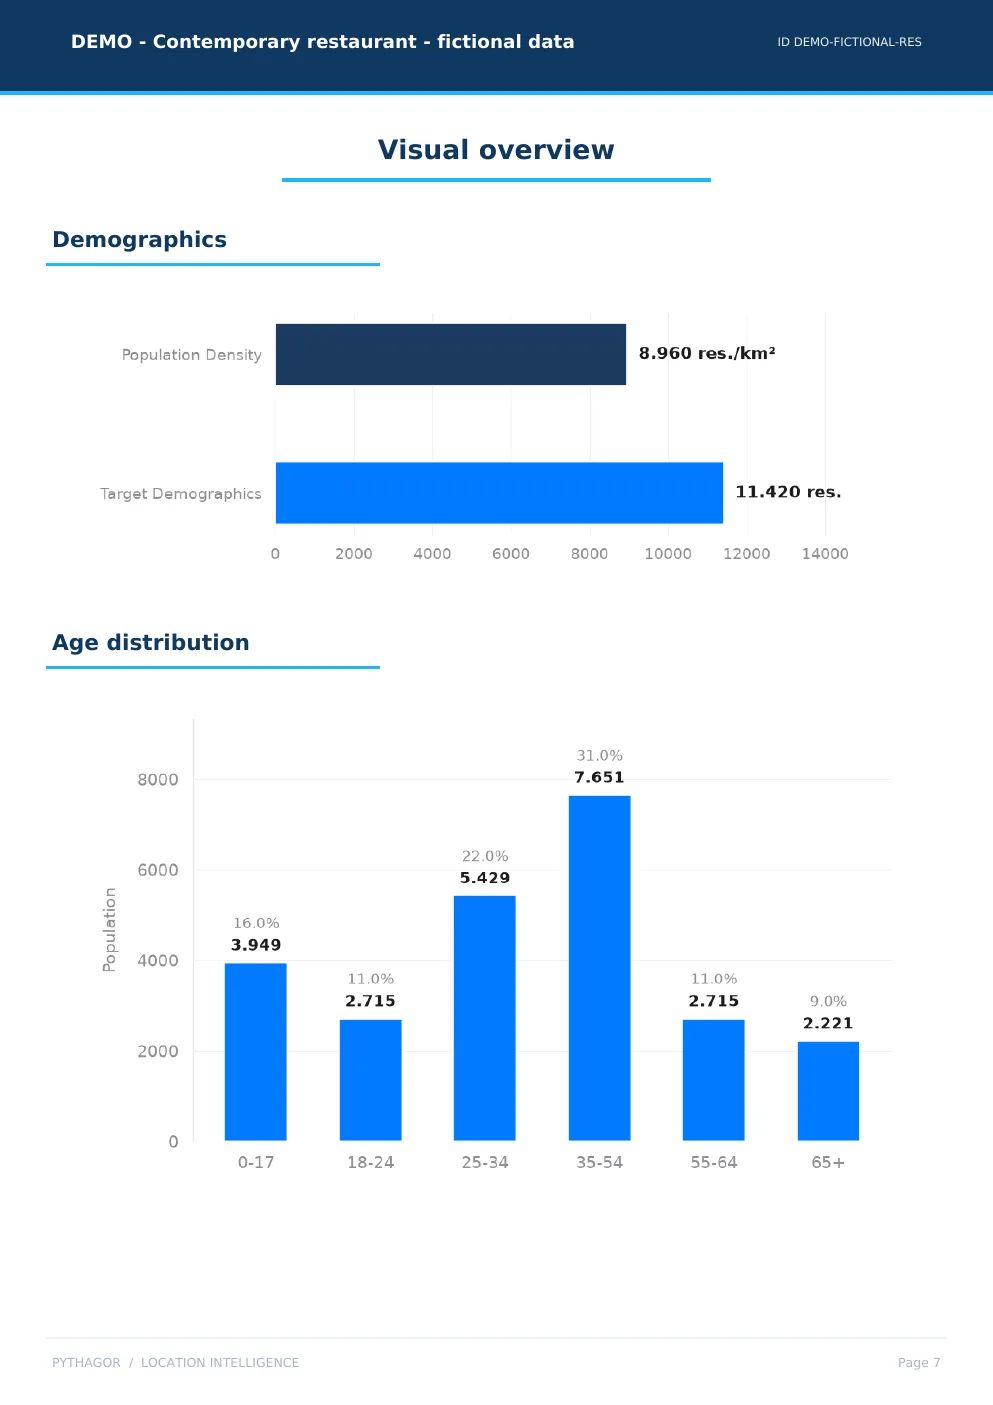
24,680 people, 11,420 of them in the target group. The 35-54 band is the widest: 7,651, or 31%. Density 8,960 per km².
Evidence 2 of 6
Who you compete with
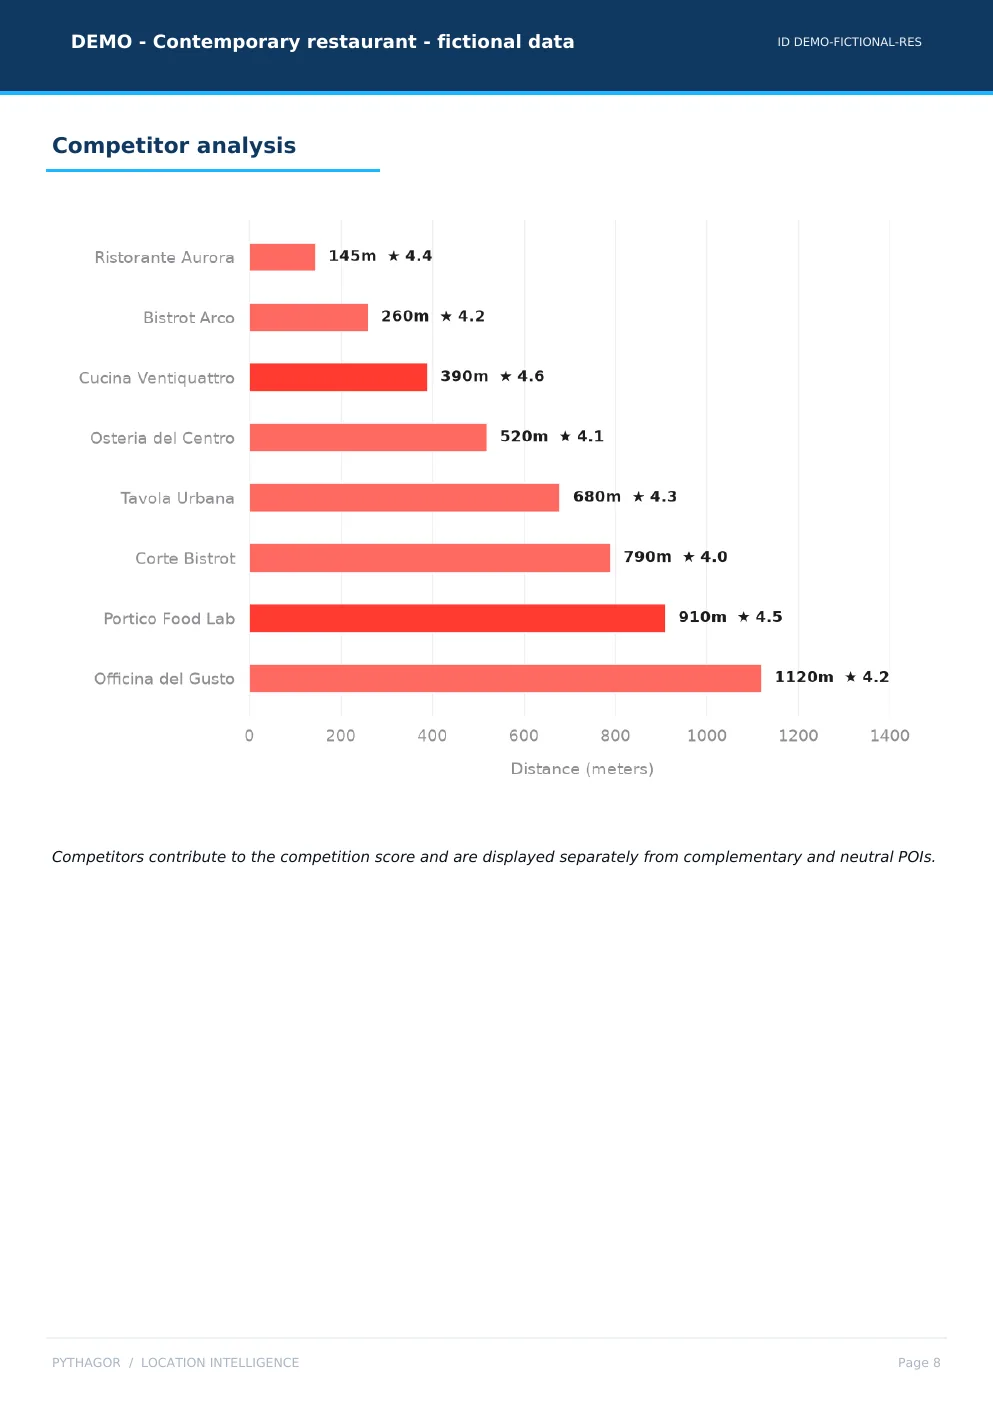
14 competitors within 1,200 metres, the nearest at 145. Average distance 602. For a restaurant the cluster attracts rather than takes away, which is why competitive space scores 99.
Evidence 3 of 6
What surrounds it
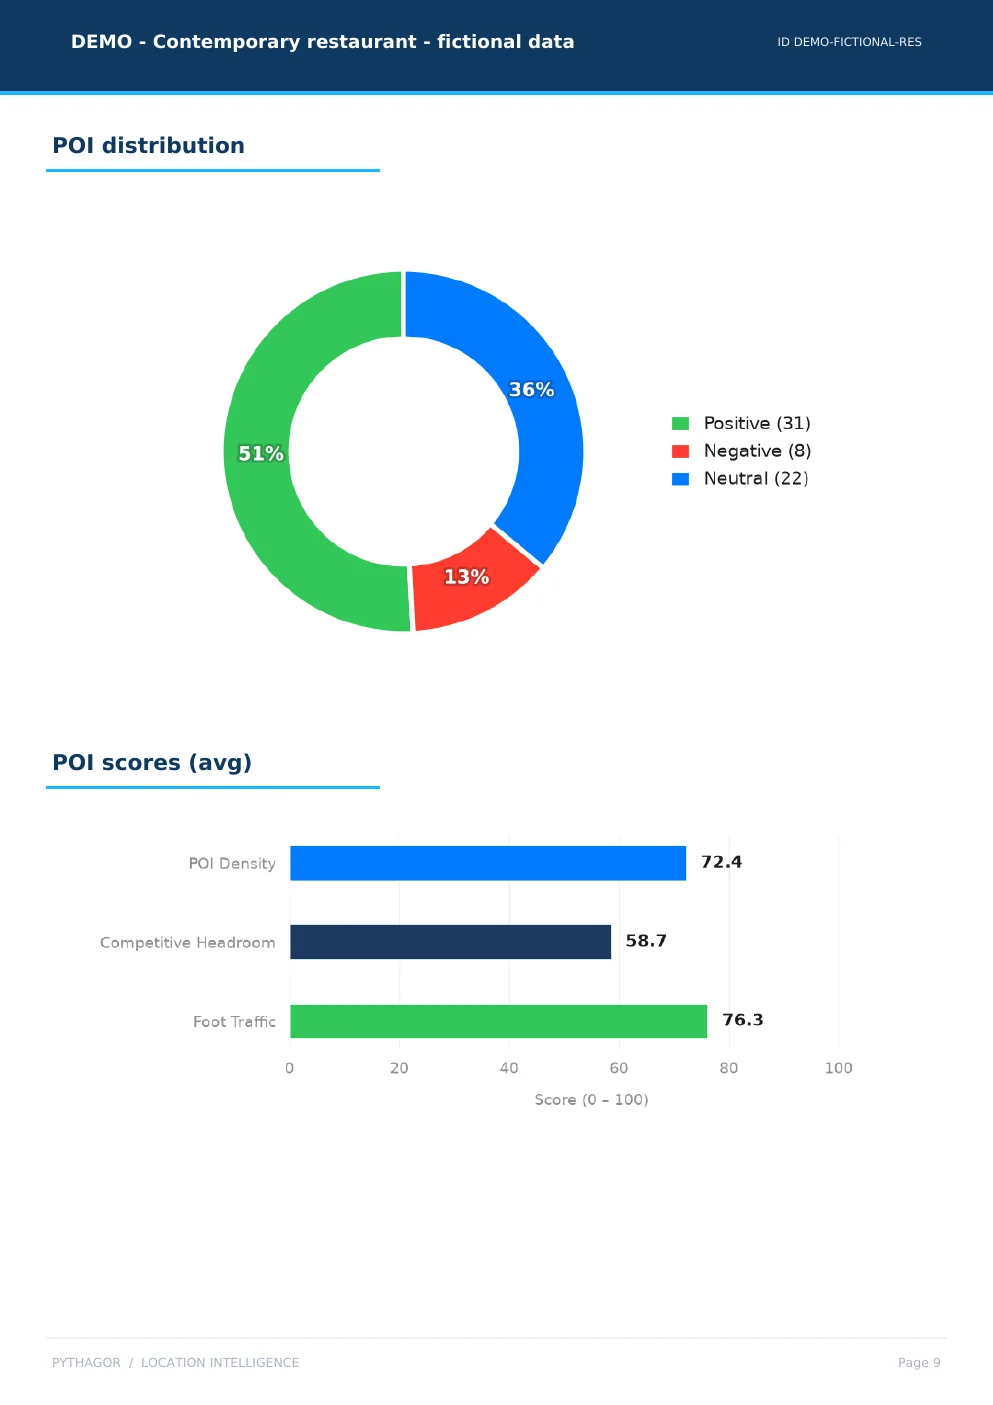
61 points of interest: 31 push, 8 subtract, 22 are indifferent. Average foot traffic scores 76.3, density 72.4.
Evidence 4 of 6
Where you could put it
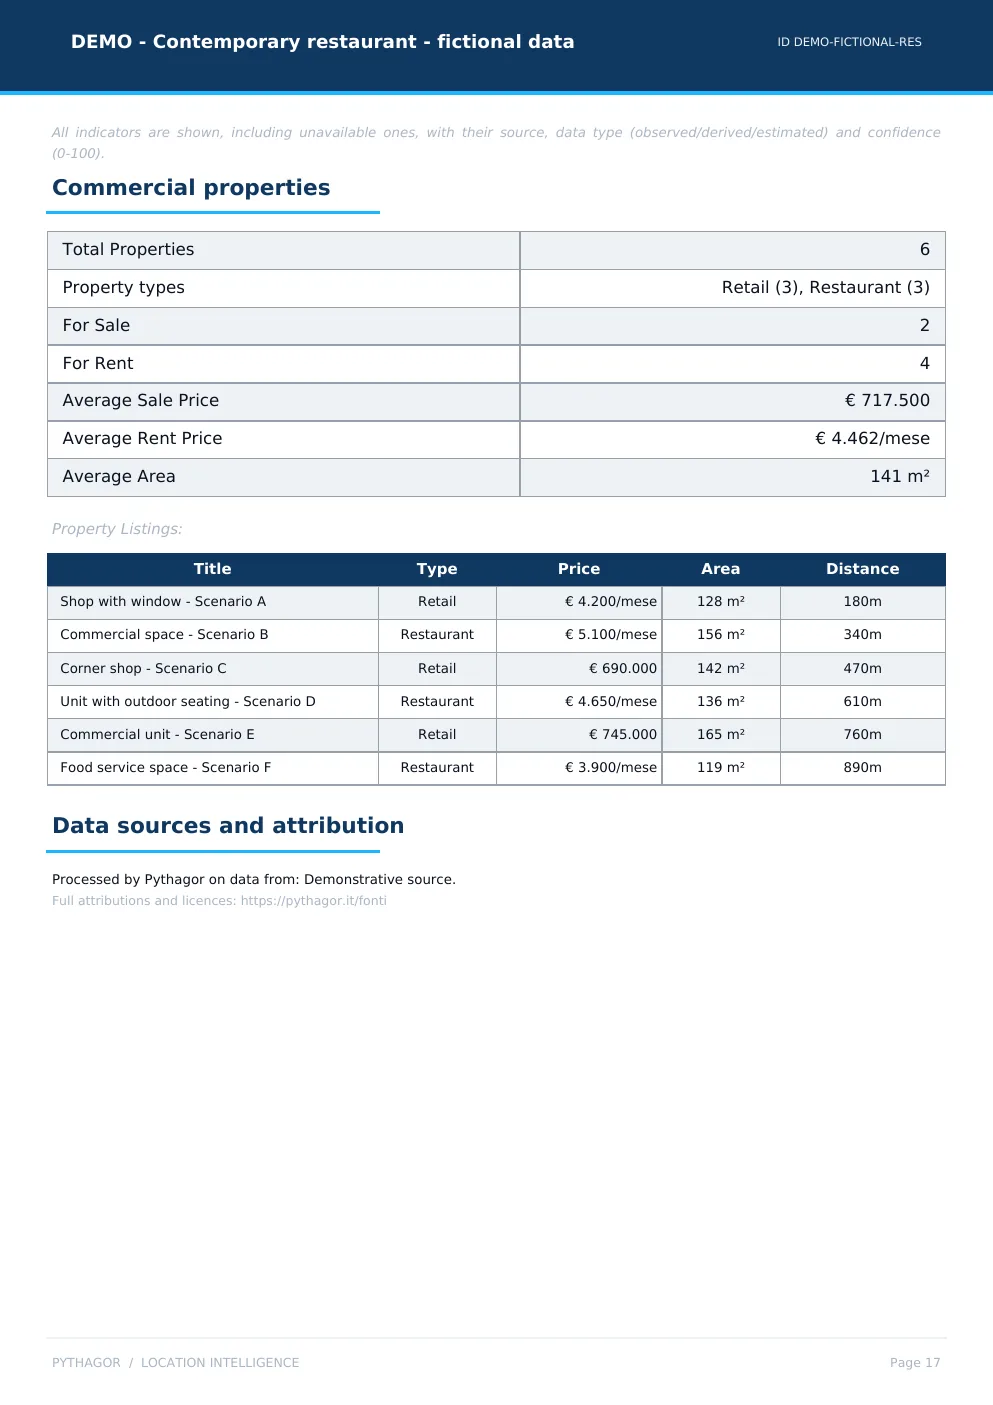
6 available units, 2 for sale and 4 to rent: an average of €717,500 to buy, €4,462 a month to rent, 141 square metres.
Evidence 5 of 6
The urban context
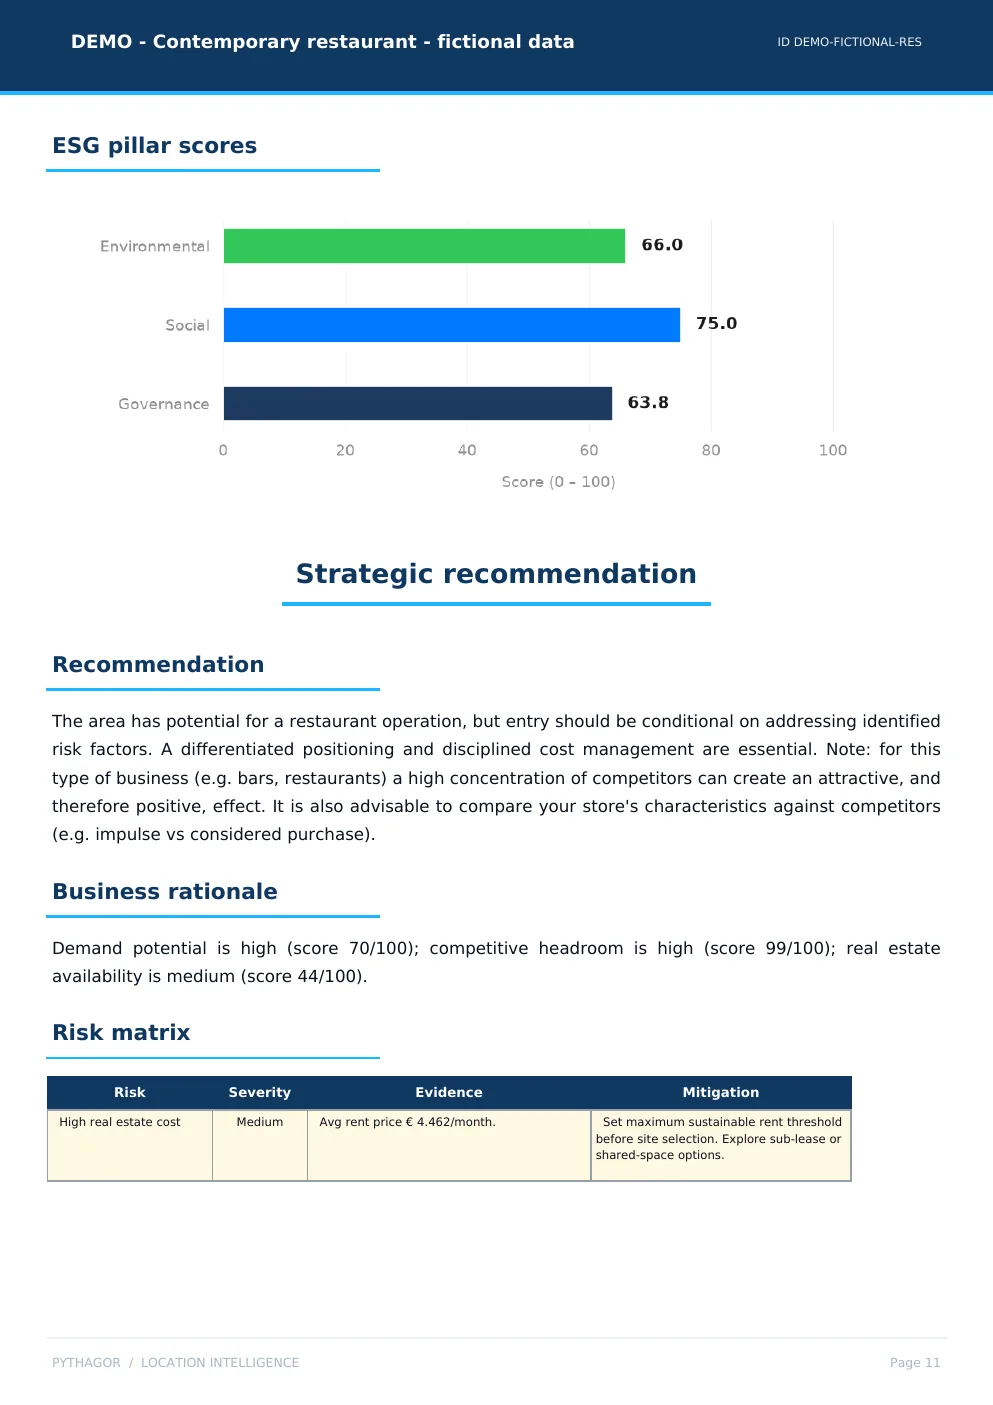
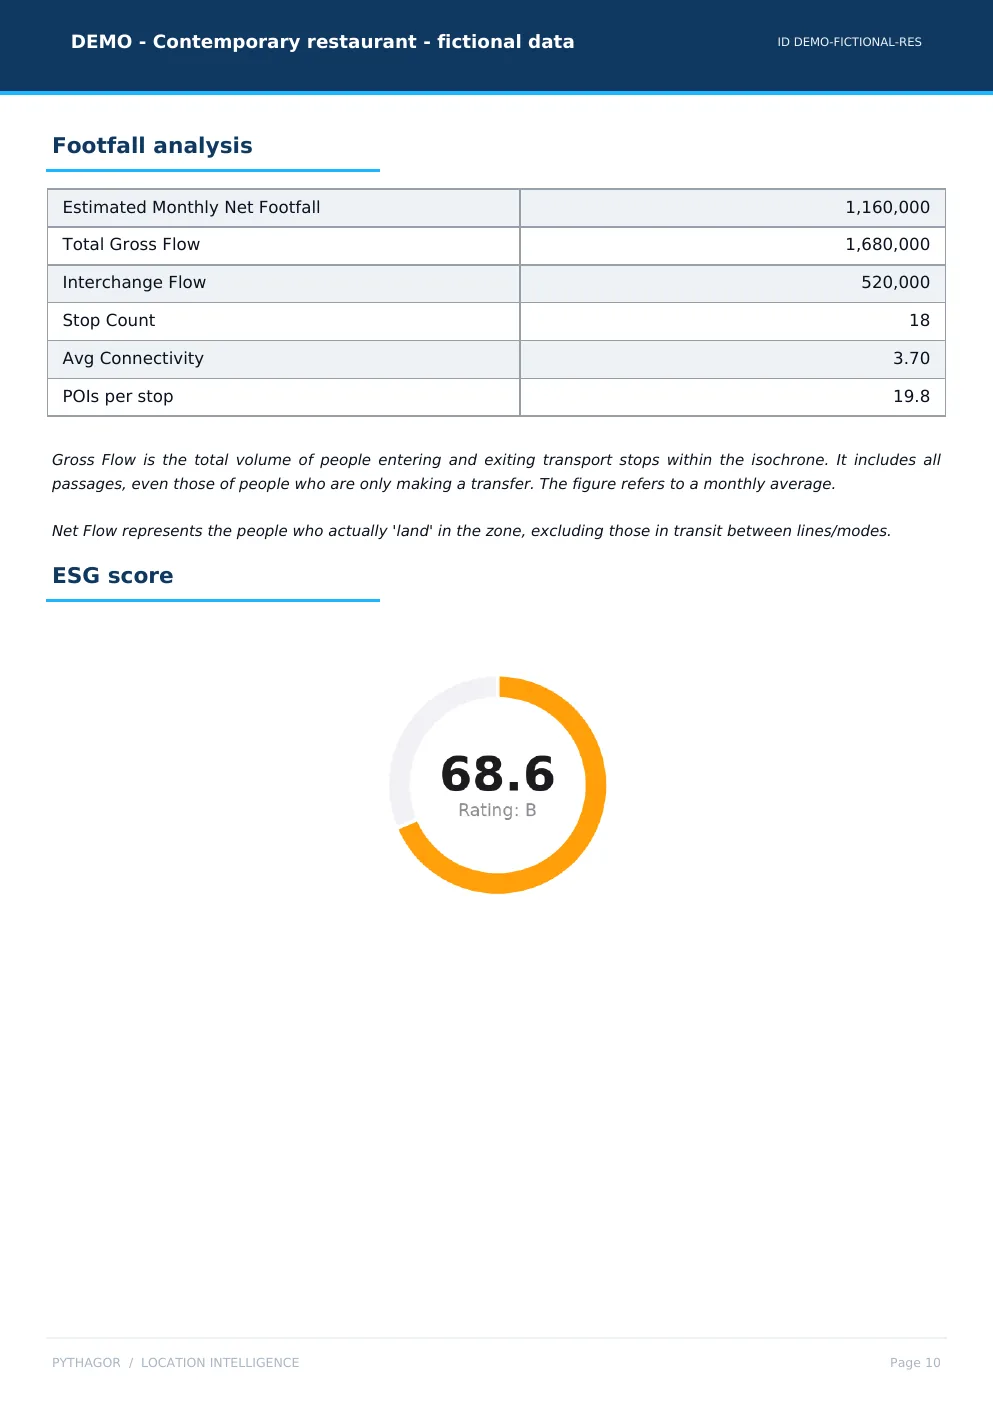
68.6 out of 100, rating B, from nine measured factors. Social pulls it up, governance holds it back.
Evidence 6 of 6
How many people pass
1,160,000 net passages a month across 18 stops, with average connectivity 3.70. It carries 6%: for a restaurant it matters less than who lives there.


Demonstrative, without ambiguity.
The report presents the product without framing invented numbers as market evidence.
Entirely fictional data
The location, figures, maps, properties and conclusions do not correspond to real-world elements.
Deterministic score
The Location Score is presented as a method output, separate from the AI-generated synthesis.
AI always disclosed
The example synthesis is explicitly identified as AI-generated content.
Want to see the report for your location?
Define the area, business and objective: your first analysis is free and uses data relevant to your case.
Request a free analysis